The Trulia Story: How Data Visualization and Neighborhood Insights Built a Real Estate Giant
Trulia differentiated itself from competitors like Zillow by focusing on neighborhood context rather than just property valuation. This case study explores how their pioneering use of data visualization, particularly heatmaps for crime and school data, fueled their growth and reshaped the online real estate industry.
In the mid-2000s, the online real estate world was a battlefield of emerging giants. While Zillow was making headlines with its disruptive home-valuation algorithm, the “Zestimate,” another contender was quietly building a different kind of empire. This company was Trulia, and its weapon of choice wasn't a financial algorithm, but a map. The Trulia growth strategy was a masterclass in differentiation, proving that for homebuyers, the context of a home is just as critical as its price tag.
Trulia’s founders recognized that a property listing was only one piece of a much larger puzzle. They bet that by answering the deep, often unasked, questions about a neighborhood—Is it safe? Are the schools good? What’s the commute like?—they could build a fiercely loyal user base. They achieved this by becoming pioneers in data visualization, aggregating complex datasets and layering them onto intuitive, interactive maps. This required a sophisticated approach to data engineering, leveraging the kind of powerful geospatial data platforms that turn raw location information into actionable business intelligence. This data-first approach didn't just create a useful feature; it defined their entire business and reshaped consumer expectations forever.
The Online Real Estate Landscape Before Trulia
To appreciate Trulia's innovation, it's essential to remember the state of online property search in the early 2000s. The first wave of real estate websites were little more than digitized versions of newspaper classifieds. They offered static lists of homes for sale with basic information: beds, baths, square footage, and a handful of photos. While functional, they were fundamentally limited.
This created a significant pain point for the user. The home buying journey was incredibly fragmented. A prospective buyer might find a promising house on one website, but their research had only just begun. They would then have to open new browser tabs to navigate clunky government websites for crime statistics, visit separate education portals for school ratings, and use a third-party tool to map potential commute times. The process was inefficient and left buyers to connect the dots themselves. This fragmentation created a clear market opportunity for a platform that could consolidate this crucial information into a single, seamless experience.
Trulia's Founding Vision: Beyond the Listing
Launched in 2005 by Stanford business school graduates Pete Flint and Sami Inkinen, Trulia was built on a simple yet profound insight: a home’s true value is inextricably linked to its community. They understood that a decision as significant as buying a home is driven by both financial and emotional factors. People don't just purchase a structure of wood and drywall; they invest in a lifestyle, a school district for their children, and a sense of security.
Trulia's founding mission was to empower consumers by providing the context that was missing from traditional listings. The platform was designed from the ground up to answer the questions that truly matter to homebuyers. Instead of just presenting what a house *is*, Trulia aimed to reveal what it would be *like to live there*. This user-centric vision became the guiding principle for every feature they developed.
The Core Differentiator: Layering Data for Deeper Insights
Trulia's genius was not in creating new information, but in aggregating existing, disparate datasets and presenting them in a revolutionary way. They took complex, often boring, public and private data and made it visually compelling and easy to digest. This transformed the daunting task of neighborhood research into an engaging process of discovery.
Pioneering Heatmaps: Visualizing the Intangible
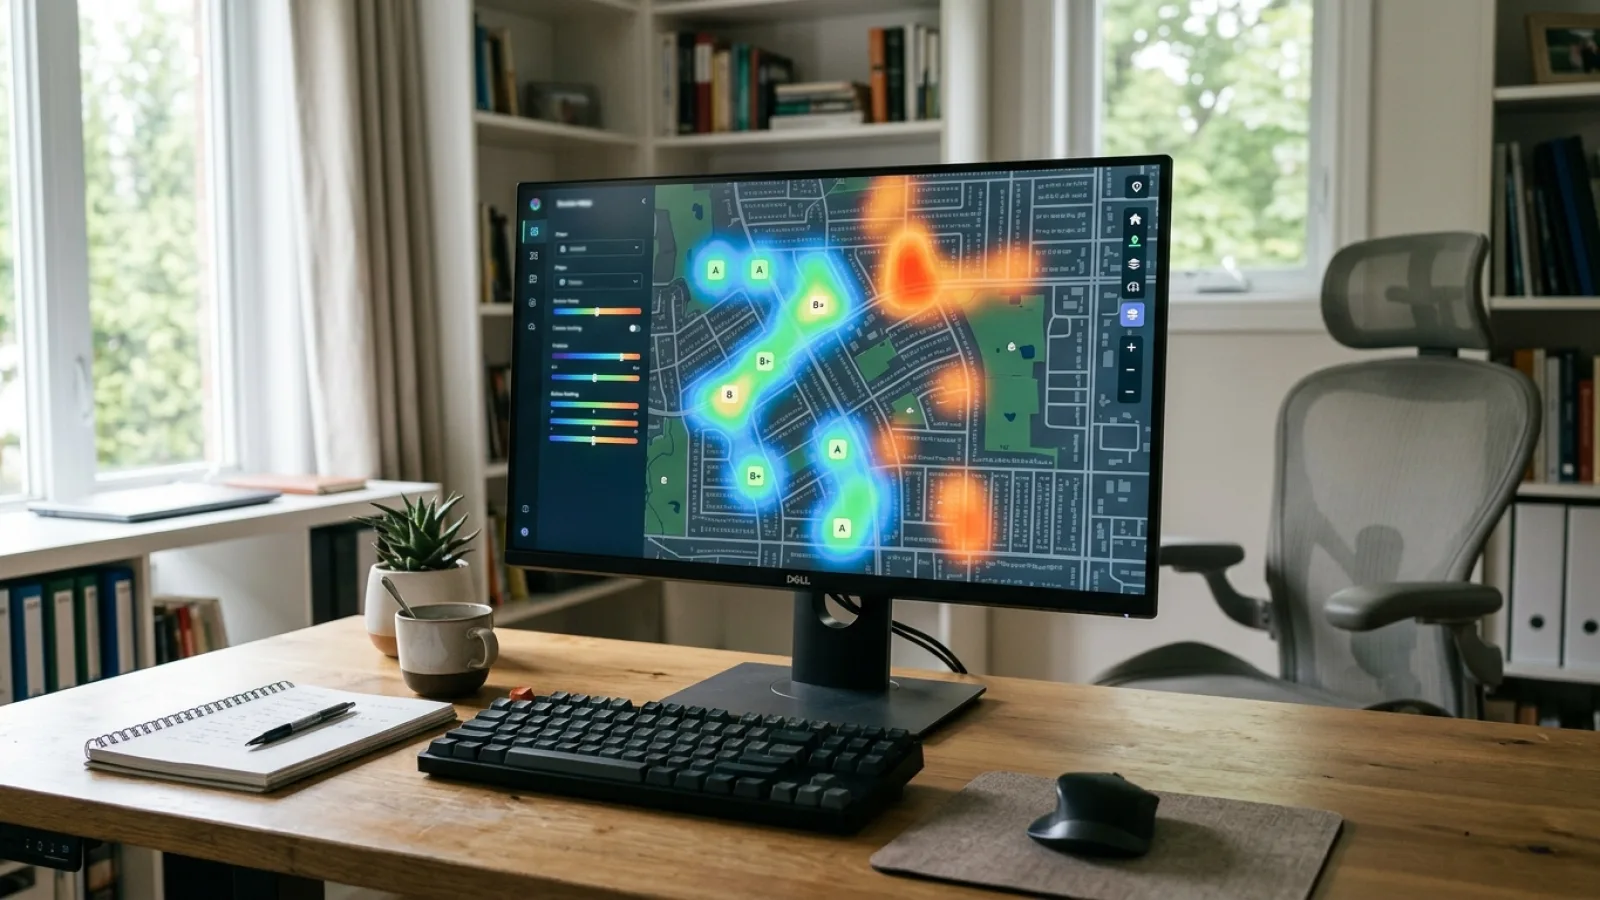
One of Trulia's most powerful tools was the heatmap. This data visualization technique had a profound psychological impact. Instead of forcing users to decipher tables of crime statistics or compare numerical school scores, Trulia used intuitive color gradients. A map glowing with green in one area and red in another could convey information about safety or school quality in a fraction of a second. This approach democratized data analysis, making it accessible to the average homebuyer, not just a data scientist.
The "Big Three" Data Layers: Crime, Schools, and Commute
Trulia focused its efforts on the three data points that most influence a homebuyer's decision:
- Crime Data: In a bold and sometimes controversial move, Trulia layered reported crime incidents onto its maps. Users could see the types and locations of recent crimes, providing an unprecedented level of transparency about neighborhood safety. This feature allowed buyers to assess risk block by block, moving beyond vague reputations to data-driven conclusions.
- School Ratings: Recognizing that school quality is a top priority for families, Trulia integrated data from services like GreatSchools. They displayed school performance ratings, attendance boundaries, and parent reviews directly on the property map, allowing users to see how different homes aligned with their educational needs.
- Commute and Amenity Data: Trulia mapped commute times to major employment centers and overlaid the locations of essential amenities like grocery stores, parks, restaurants, and public transit stops. This helped users visualize their daily routines and understand the true convenience of a potential home.
Sourcing and Verifying Data: Building the Foundation of Trust
Aggregating this data was a monumental task. It required building a robust technical infrastructure and forging partnerships with a wide array of data providers, from municipal governments to private companies. Critically, Trulia was transparent about its data sources. By citing where the information came from, they built a foundation of credibility and user trust. This set them apart from competitors and established their brand as a reliable, objective resource in a sales-driven industry.
How Data Visualization Fueled the Trulia Growth Strategy
Trulia's data-centric features were not just a novelty; they were the engine of the company's growth, creating tangible business advantages that propelled them to the top of the market.
Driving User Engagement and Time-on-Site
The interactive maps were captivating. Users would spend far more time on Trulia's site compared to competitors, not just clicking through photo galleries but actively exploring entire communities. They would pan across neighborhoods, toggle data layers on and off, and dive deep into the local context. This high level of engagement was a powerful signal of user satisfaction and a key metric that demonstrated immense value to real estate agents and advertisers.
Building a Defensible Moat Against Competitors
Trulia's competitive advantage was difficult to replicate. While any company could scrape property listings, building the complex backend required to source, clean, process, and visualize dozens of disparate datasets was a significant undertaking. It demanded expertise in data science, software engineering, and business development. This data infrastructure became a defensible moat that protected Trulia's market share from new entrants.
Creating a Powerful SEO Engine with Localized Content
From a digital marketing perspective, the data layers were a goldmine. Each neighborhood, school district, and data filter created an opportunity for a unique, highly specific landing page. This allowed Trulia to rank for an enormous volume of long-tail keywords, such as "homes for sale in Irvine with top-rated elementary schools" or "San Francisco neighborhoods with low crime rates." This strategy drove a massive and sustainable flow of high-intent organic traffic to the site.
The Trulia vs. Zillow Dynamic: A Tale of Two Strategies
For years, the online real estate market was defined by the rivalry between Trulia and Zillow. While often seen as direct competitors, they approached the market with fundamentally different philosophies.
Trulia's Neighborhood Focus vs. Zillow's Property Valuation (Zestimate)
The strategic difference can be summarized by the primary question each platform helped users answer. Zillow's hook was the Zestimate, which addressed the financial question: "What is this house worth?" Trulia, on the other hand, focused on the qualitative, lifestyle question: "What is it like to live here?" Zillow drew users in with financial curiosity, while Trulia captured them with neighborhood discovery.
| Feature | Trulia's Approach (Pre-Merger) | Zillow's Approach (Pre-Merger) |
|---|---|---|
| Primary Question | "What is it like to live here?" | "What is my home worth?" |
| Core Technology | Data Visualization & Heatmaps | Proprietary Valuation Algorithm |
| Key Data Points | Crime, Schools, Commute, Amenities | Sales Comps, Property Details, Market Trends |
| User Hook | Neighborhood Discovery & Lifestyle Fit | Financial Curiosity & Investment Angle |
The Eventual Merger: Combining Context with Valuation
In 2015, the rivalry ended when Zillow Group acquired Trulia for $3.5 billion. The move was a brilliant strategic consolidation. Rather than a hostile takeover, it was a merger of complementary strengths. Zillow understood that by acquiring Trulia, it wasn't just eliminating a competitor; it was absorbing a beloved brand with a different, yet equally powerful, value proposition. The acquisition allowed Zillow Group to dominate the market by offering users a comprehensive experience that answered both the financial and lifestyle questions of home buying under one corporate umbrella.
Lessons for Today's PropTech Innovators
The story of Trulia's rise offers timeless lessons for entrepreneurs and data scientists, particularly in the PropTech space.
Lesson 1: Solve for the User's Unasked Questions
Successful products don't just provide what users search for; they anticipate their underlying needs and anxieties. Homebuyers don't just want a list of available properties; they want confidence and peace of mind in their decision. By providing data on safety, education, and community, Trulia addressed these deeper concerns directly.
Lesson 2: Turn Complex Data into Simple, Actionable Visuals
The value of data lies not in its raw form, but in its interpretation. Trulia's success demonstrates that the most effective way to communicate complex information is often visually. A simple heatmap or a well-placed icon can be more powerful than pages of statistics, empowering users to make better, faster decisions.
Lesson 3: Data-Driven Trust is a Powerful Marketing Tool
In an industry often characterized by sales pitches and subjective opinions, objective data is a powerful currency. By sourcing data transparently and presenting it without bias, Trulia built a brand that users trusted. This credibility became one of their most valuable assets and a potent marketing tool that advertising alone could not replicate.
The Legacy of Trulia's Data-First Approach
Trulia's influence on the real estate industry cannot be overstated. They fundamentally changed what consumers expect from an online property search. Features that were once revolutionary—like interactive crime maps, integrated school ratings, and commute calculators—are now standard, table-stakes features on nearly every major real estate portal in the world.
The Trulia growth strategy was a powerful testament to a simple idea: in real estate, the story of a home doesn't end at the property line. By looking beyond the four walls of a house and focusing on the community around it, Trulia not only built a billion-dollar company but also empowered a generation of homebuyers to make more informed decisions.
Frequently Asked Questions (FAQ)
Q1: What was Trulia's main competitive advantage before the Zillow merger?
A1: Trulia's main competitive advantage was its focus on neighborhood context through data visualization. While competitors focused on listings, Trulia layered data like crime rates, school ratings, and commute times onto interactive maps, answering deeper lifestyle questions for homebuyers.
Q2: How did Trulia get its data for crime and school ratings?
A2: Trulia aggregated data from multiple third-party sources. For crime data, they partnered with providers like CrimeReports.com and SpotCrime.com, which collected information from law enforcement agencies. For school ratings, they primarily integrated data from GreatSchools, a non-profit that rates K-12 schools.
Q3: Why did Zillow acquire Trulia?
A3: Zillow acquired Trulia for several strategic reasons. It eliminated its closest competitor, massively increased its market share of online real estate traffic, and combined two complementary brands. Zillow's strength was in property valuation (the Zestimate), while Trulia's was in neighborhood context, creating a more comprehensive offering for consumers under one parent company.
Q4: Is Trulia's data visualization strategy still relevant today?
A4: Absolutely. Trulia's strategy is more relevant than ever. They set the industry standard, and today's homebuyers expect rich, visualized data as a baseline feature on any property portal. The ongoing challenge for PropTech companies is to find new, unique datasets and even more intuitive ways to visualize them to gain a competitive edge.